
5. Analysing the Conditions
MSP is a complex process involving a wide range of stakeholders across multiple levels of governance, over ecologically highly connected, but varying marine basins. A major challenge to effective transboundary MSP collaboration is the diversity of maritime activities and jurisdictional boundaries, as well as the interconnectedness of marine users and ecosystems. Diverse and cross-cutting governance processes and competing national interests create the potential for conflict and misunderstandings. Overlapping international and area specific regulatory systems further exacerbate this already complicated situation.
Spatial planning is deeply embedded in a country’s history, social, cultural and political traditions, as well as the state of economic and urban development. Indeed, different legal and administrative structures create obstacles to cooperation, such as varying planning systems and regulations. For example, in some countries in a given sea basin, the MSP authority may be from the national transport ministry, while in others it may be from the environment ministry. This can at times lead to a mismatch in priorities in neighbouring MSP plans. Other factors include socio-cultural factors as well as ecological and physical characteristics found throughout an LME.
These contextual and institutional differences need to be taken into account as part of analysing current conditions in an LME when initiating an effective MSP process. A well-developed understanding of participating countries’ individual ecological context and planning systems is essential for successful and durable cross-border collaboration.
At the same time, MSP projects should avoid the risk of getting stuck in too much data and information gathering without leaving sufficient space for addressing actual issues and problems. Thus, careful attention has to be paid towards keeping the focus on information which is really relevant and necessary for the transboundary MSP questions and issues to be tackled.
The following section describes the various elements and related possible tools to be used when analysing current conditions. This phase is important for effective transboundary MSP collaboration because it builds collective understanding of the diversity of maritime activities, planning and governance systems, and ecosystems, as well as how these elements are related to one another. Building a common knowledge base on the current conditions lays the foundation for understanding potential future conditions (chapter 6) as well as planning solutions (chapter 7).
5.2 Defining Marine Spatial Planning boundaries
This toolkit is mainly targeted towards supporting MSP at various transboundary scales relevant to an LME. These could be the entire LME itself, or sub-LME areas shared by two or more national jurisdictions, such as ecologically or biologically significant marine areas (EBSAs).
As described in Chapter 2 of this toolkit, there are special considerations to take into account regarding ecosystem boundaries and legal boundaries when defining a planning area for MSP, especially given the interconnected nature of maritime activities and ecosystems, including species connectivity (please see 2.2). In relation to analysing conditions, it is worthwhile to start the process of defining a planning area by doing an overarching strategic stocktake of current and future conditions for the overall LME area, to then potentially identify more detailed “hot spot areas,” as described further below.
Jurisdictional issues are likely to be of central importance when defining the planning area for the purpose of transboundary MSP. The United Nations Convention on the Law of the Sea (UNCLOS) defines a range of maritime areas in which coastal states can exercise jurisdiction, and thus should be considered in an LME transboundary MSP process (Figure 27). Further information on jurisdictional boundaries under international legal conventions can be found in the Governance Toolkit Chapter 3.1 International legal framework and institutions.
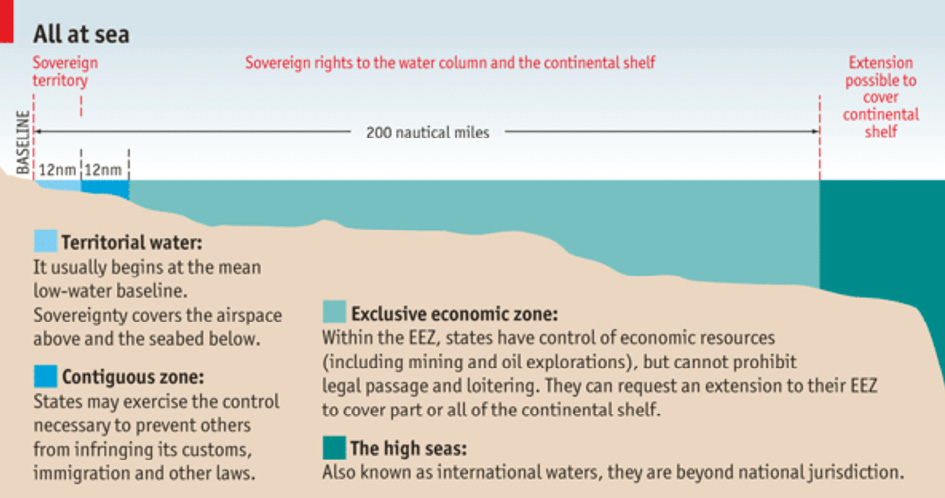
Figure 27: Maritime areas defined under UNCLOS (The Economist 2012)
When defining a planning area, attention might also be given, for example, to:
•The geographical extent of internal, archipelagic and territorial waters
•The extent of exclusive economic zones, if established pursuant to UNCLOS
•The outer limits of jurisdictional powers, likely to depend upon the enclosed or open nature of the sea basin
•Sub-national borders and responsibilities in the coastal zone and offshore
•National / sub-national departmental responsibilities and areas of competence
•National / sub-national MSP initiatives and planning areas
•The extent of integrated coastal management and river basin management initiatives
•Other international marine regions and administrative areas
Planning areas can begin to be defined by assembling the relevant jurisdictional data described above with the help of marine data infrastructures to include data in a geographic information system (GIS) (see 5.7). These can be combined with the results of spatial ecological models (see 5.8.1.4) which help support delineation of ecological boundaries, to identify planning areas (see example 5.2.2). However, it is not always necessary to start with compiling data in a GIS to define planning areas – it is also possible to begin by simply drawing on a map (please see 5.7.1).
The flexible/soft approach to defining the boundary of transboundary areas involves setting or defining broad areas which are not necessarily based on jurisdictional boundaries but rather to consider other factors important in better analysing and understanding the transboundary area especially for cross border purposes. Such an approach enhances the application of the ecosystem-based approach where connectivity and ecosystems boundaries are considered (please see example 5.2.1).
In many cases, so-called ‘grey areas’ may appear, which depict areas where the exact demarcation of legal boundaries between two or more countries are unclear or disputed. Where boundaries have not been agreed, it may be possible, for the purpose of the exercise, to agree on theoretical boundaries, or it may be preferable to leave any such boundary undefined (see example 5.2.3).
More detailed MSP planning exercises may lead to a more ‘nested’ approach (i.e. below the national or sea-basin planning level – see example 5.2.4) where certain transboundary (cross-border) ‘hotspot’ areas are identified (see example 5.2.5). This could include cases where two or more activities and interests intersect across two countries and/or overarching ‘hot topics’, which cannot be solved by one country on its own, but instead require an overarching transnational approach. Even though they are context specific, such transnational issues could refer to offshore energy infrastructure, shipping routes, and conservation areas which occur close to borders, or they could also refer to combinations of multiple uses which require some coordination between the countries or sub-national jurisdictions in question.
5.2.1 EXAMPLE: Defining the flexible boundary for the transboundary area (TPEA project)
The two pilot case studies in the TPEA project used a flexible/soft approach where factors considered included data availability, stakeholder engagement activities and jurisdictional issues. For example, the transboundary area between Portugal and Spain was initially defined broadly, by drawing a semi-circle of 60 nm radius from the point where the land border meets the sea, mapping cross-border activities and transboundary impacts allowed the identification of areas of common interest between the two countries.
The definition of the transboundary area between Ireland and Northern Ireland (Irish Sea) took account of a number of jurisdictional issues such as:
•fewer and less clearly established administrative boundaries;
•a more graded and shifted environment than on land with fewer features for planning; and
•the mobility and multi-scalar consequences of maritime activities.
The area was defined as extension of the international land border on the east coast into the Irish Sea (see Figure 28).
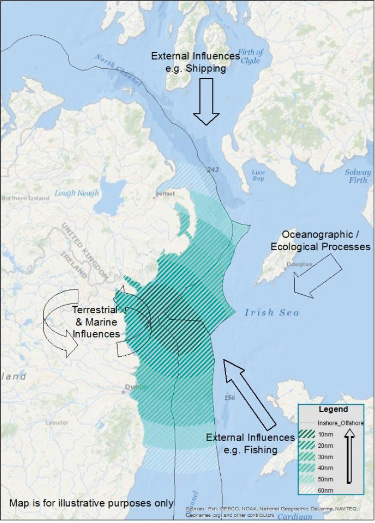
Figure 28. Transboundary area between Ireland and Northern Ireland
It is important to note that this approach is only applied for analysis and understanding purposes in a pilot project, and does not have any reference to the jurisdictional competences of the countries and measure developed from such analysis may not apply to the transboundary area.
When defining the precise limits of the pilot area, a number of aspects have been considered, combining hard borders when necessary for jurisdictional and governance reasons and softer gradients embodying transboundary effects and other geographical considerations:
•Between Ireland and UK there is no boundary linking the land boundary to the territorial limit. Therefore, in a pragmatic way, an imaginary centre line running directly from the axis point where the territorial limit meets the contiguous zone to the end of the land border was used.
•The outer limits of the pilot area had regard to the jurisdictional reach of the authorities involved in the project. This was determined by the boundaries of Republic of Ireland and Northern Ireland waters with other jurisdictions (especially Wales and the Isle of Man).
•“Transboundary” cannot be represented by hard borders because these effects are graded, decreasing in intensity with distance from the border, and also vary in their scale according to different environmental conditions and maritime activities. Therefore, degrees of transboundary effects were represented in the pilot area map with graded / buffer zones centred on the border, and arrows indicating wider influences. At the same time, it is understood that pilot planning documents need to refer to a clearly defined area in order to avoid legal uncertainty. The focus was therefore on identifying shared resources, cross-border activities and cross-border impacts.
•The pilot area focused primarily on marine space, but overlap with land and therefore land-sea interaction was reckoned to be necessary in order to capture coastal influences. To avoid interfering unduly with ICZM initiatives, the project aimed to ensure that land/sea interactions were properly considered.
5.2.2 EXAMPLE: Enlarging MSP boundaries to achieve comprehensive ecosystem-based management (CCALMR & CTI-CFF)
Two case studies (Commission for the Conservation of the Antarctic Marine Living Resources (CCALMR) and the Coral Triangle Initiative (CTI-CFF)) suggest that the mismatch between jurisdictional and ecosystem boundaries can be reduced when the planning area is enlarged. Both processes carefully aligned their boundaries with the respective marine ecosystems. An important note is that the MSP processes included a mandate to implement measures for cross-sectoral ecosystem-based management throughout the planning area. On a regional transboundary scale, like in the case of the CTI-CFF , there can be some friction cases due to overlap with mandates of other management institutions. Therefore, it is essential to align the MSP process with the mandates of other institutions that manage marine resources within the planning area.
5.2.3 EXAMPLE: Finding ways of bypassing obstacles related to
Grey Zones (Baltic SCOPE)
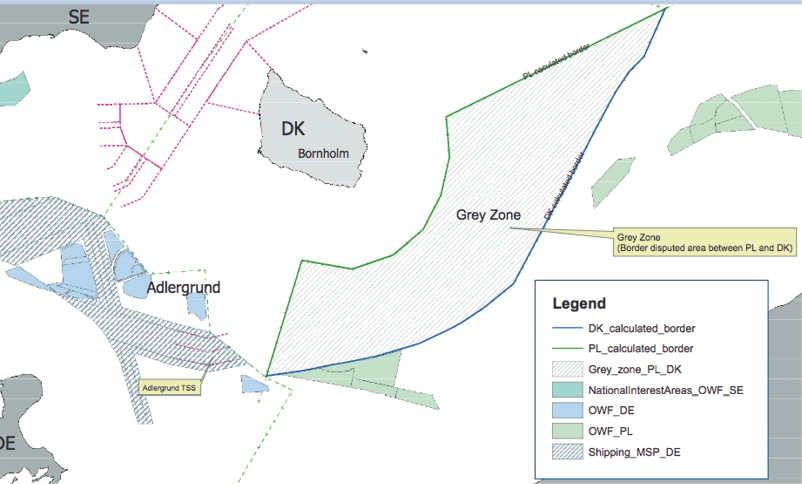
Figure 29: “Grey Zone” disputed area between Poland and Denmark. The map indicates the varying border calculations by each country (Baltic SCOPE 2017)
The Baltic SCOPE project allowed planners to think beyond what was originally thought possible when dealing with an area of overlapping interest. The “Grey Zone” is a disputed area in the EEZ of Denmark and Poland, which is an issue that goes beyond the planning mandates of the two countries, but has clear implications for their work (Figure 29). While a resolution for this disputed area cannot be solved between planning authorities, the planners of the two countries were successful in engaging their Ministries of Foreign Affairs into a bilateral dialogue. This interaction eventually led to the identification of a temporary solution, which made it possible for planners to proceed with their MSP processes, while the border conflict is solved at a higher political level. Although sceptical at the beginning, planners were highly satisfied with the pragmatic result of this dialogue. This is an approach to collaboration, which is also applicable to other grey zones, such as the harbour approach of the Świnoujście-Szczecin area between Germany and Poland, and other similar cases within and outside the Baltic Sea.
5.2.4 EXAMPLE: Planning traditions in the ‘nested approach’ (PartiSEApate)
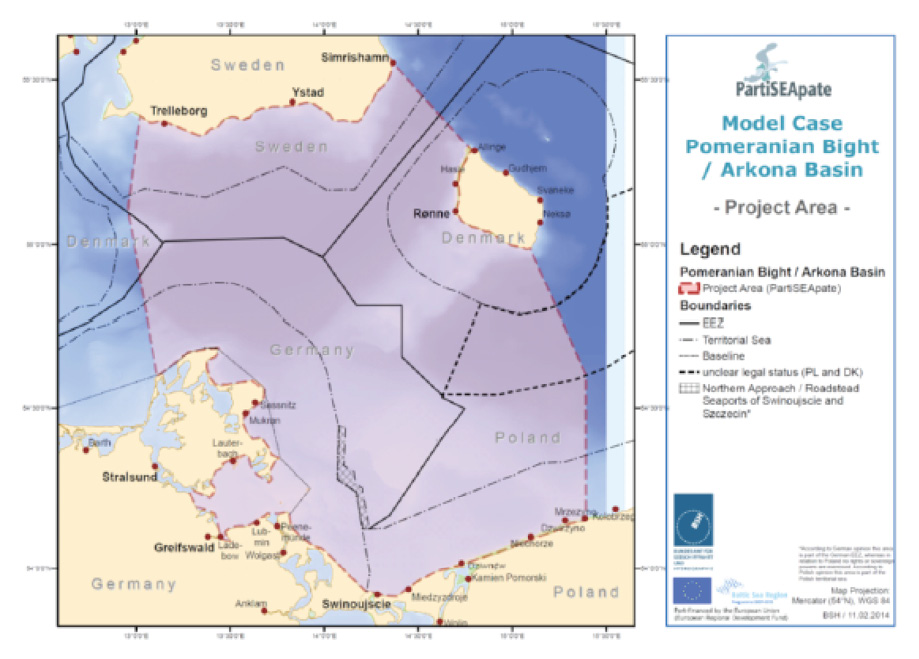
Figure 30: PartiSEApate model case for the Pomeranian Bight / Arkona Basin (Käppeler, et al. 2012)
The PartiSEApate project aimed to develop an appropriate governance model for transnational consultation and coordination on MSP within the Baltic Sea Region. It produced Recommendations, as well as a “Report on transnational cooperation and dialogue in the Pomeranian Bight / Arkona Basin” (a border area between Germany, Sweden and Poland). An analysis was carried out of actual and recommended consultation processes in two on-going transboundary infrastructure projects in the area, serving as examples of transnational cooperation and dialogue. The project concluded that countries have different traditions when it comes to data sharing and that MSP has a different role in different countries as well. In addition, the national cultures determine in different ways what is acceptable communication; in some countries, formal structures are required as there can be reluctance to rely on informal discussions. The partners from the three countries surrounding the Pomeranian Bight co-developed recommendations for a pan-Baltic MSP institutional framework and governance model including how to improve transnational consultation and cooperation, in their MSP Governance Framework Report (xxxviii), which also provided input for the HELCOM-VASAB Guidelines
on transboundary consultation and cooperation and public participation.
5.2.5 EXAMPLE: Identification of joint hot spot areas (Baltic SCOPE)
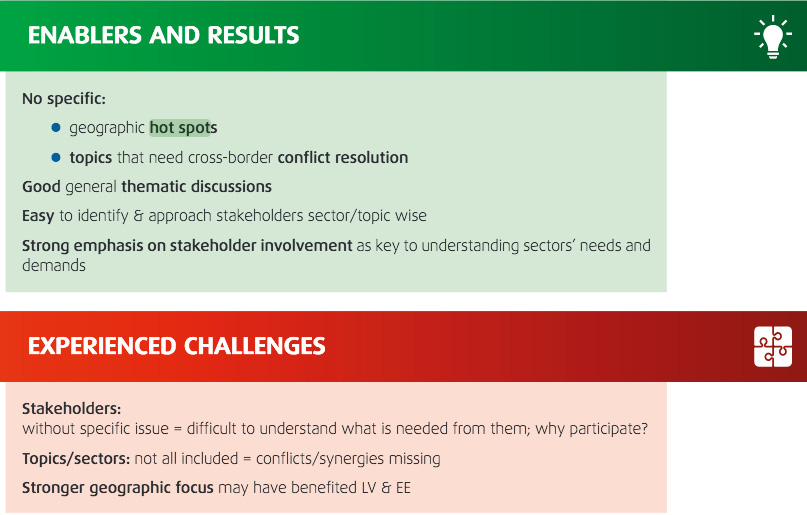
Figure 31:. Challenges and enablers for the Central Baltic Case Study from Baltic SCOPE (Urtāne et al. 2017)
The Baltic SCOPE project concentrated on two transboundary case study areas: the southwest Baltic Sea (SWB) and the central Baltic Sea (CB). Although project planners shared the same overall goals and followed the same working stages, each case study area developed different approaches and tools for dealing with their transboundary MSP issues. In Central Baltic case, in the absence of clear transboundary conflicts between countries and a relatively strong sector divison of management, the CB case adopted a more thematic, stepwise, topical and process-based approach. Central features for interactive learning within the case have been topic papers, thematic meetings and a trans-boundary mapping exercise. The interaction started at the sector level and became increasingly cross- sector, including stakeholders at all steps. Despite an overall positive evaluation of the case approach, survey respondents pointed at a number of challenges (see Figure 31). There was some disagreement on the solutions and geographical focus. Whilst some respondents criticised the lack of a “common core” in terms of solutions and the loss of a possible geographical focus, which mainly could have benefited Latvia and Estonia, another respondent argued that the case did not identify specific geographic hot spots that need spatial solutions nor certain topics that need cross-border conflict resolution. On the contrary, the South West Baltic case took a geographic approach, that involved zooming in on six focus-areas and identifiying conflict issues and concrete solutions where sectoral developments potentially affect neighbouring countries. For instance, the Kriegers Flak focus-area, was seen as important and potentially conflicting for the construction of offshore windfarms and interest for gravel extraction. The Oresund strait, where Denmark and Sweden border only in territorial waters is one of the busiest shipping routes of the Baltic; while the same areas has also designated MPAs, raw material extraction and fisheries as well as the increasing interest for integration between the two main cities (Copenhagen & Malmö) in the area (Urtāne et al. 2017).
5.3 Understanding the different levels and boundaries of the governance systems in place
Most transboundary MSP processes will be confronted with a context of nested and overlapping governance and regulatory systems at international, regional and local levels as well as gaps in regulation and responsibilities. Existing policy and legal frameworks that may be relevant to transboundary MSP are presented in the Governance Toolkit Chapter 3.1: International legal framework and institutions. Methods for assessing governance are described in the Governance Toolkit Chapter 5.2 and in the Strategic Approach Toolkit Chapter 2.5: Governance module. Section 1 Governance of the LME-LMSA Scorecard Indicator Framework provides indicators which could be used in a governance assessment.
The most important governing actors for different maritime sectors (e.g. shipping, fishing, offshore energy, etc.) in question will not necessarily be placed at the same level of governance and geographic scale in each country involved. While environmental regulation is often complex and encompasses all levels of governance, energy and fisheries regulation may be regulated at higher (multi-national) levels, whereas shipping is even primarily guided by global regulations and actors, such as International Maritime Organisation (IMO). The Convention of Biological Diversity (CBD) provides an overarching framework for protecting marine ecosystems, including visions and goals for establishing MPAs, which then need to be implemented at lower levels. Thus, MPAs imply nested regulations defined at different levels of governance. For MSP to be effective, planners should be aware of all these institutional levels and their various competences across geographical scales.
Moreover, there is often also a geographical overlap between sectoral governance systems. Global conventions, sea-basin specific agreements and national regulations for different sectors impose norms and regulations over the same geographical space. These can either co-exist or conflict, depending of the level of impact that they have on each other (please see 5.5). For example, designating MPAs does not necessitate the need to impede shipping traffic. However, depending on technical and other circumstances, maritime traffic can have a detrimental impact on the marine environment, which may need to be addressed either through regulation or separation schemes. Here MSP comes in as a means for coordination – yet it requires a well-developed understanding of the overlaps of uses and relevant governing actors (e.g. that changes in shipping routes need to be resolved through the global IMO, whereas designating MPAs is often a national or sub-national responsibility).
5.3.1 EXAMPLE: Analysis of policies and legislations with reference to MSP (SIMCelt project)
Existing legislations and policies in various countries set the context for transboundary MSP development and implementation. It is important to understand the various international, national and local policies and legislations that can foster transboundary MSP. This approach was used in the SIMCelt project to inform issues and recommendations for enhancing cross border planning in the Solway Firth, which is a unique and single estuary divided by the national border between Scotland and England, and shares boundaries with Ireland and the Isle of Man, thus being subject to the requirements of two separate marine planning systems. The approach assessed legislative frameworks and marine and coastal planning policies including Local Development Plans and made recommendation and options for implementation.
In applying such an approach, it is important that the similarities and differences between the various national policies which relate to MSP and transboundary aspects of land sea interactions are identified and ways of bridging the differences are discussed. The approach for the SIMCelt project developed various requirements for transboundary MSP (see Figure 32) to understand how these have been addressed and the differences in the policy and planning system of the various UK administrations. Key issues and areas of focus to enhance planning across borders and align marine planning systems were also developed.
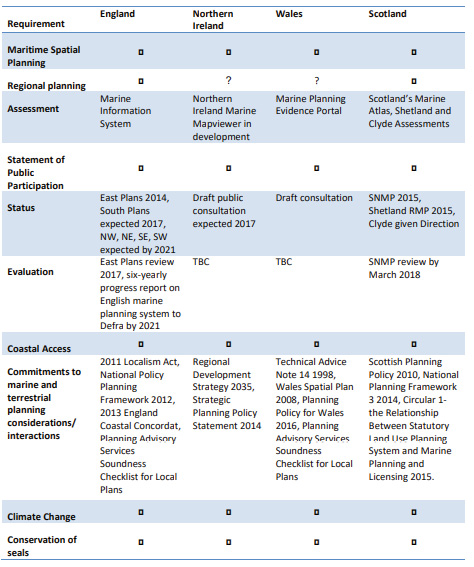
Figure 32: Example of policy analysis for Solway Firth (SIMCelt project)
5.4 Understanding planning systems, structures and responsibilities
Next to the overarching governance system, it is most important for transboundary MSP processes that there is a good understanding of the planning systems within the countries involved. In the same way that specific issues and interests define the MSP objectives, the mandate of the planning agencies involved will highly influence the scope of the given plan; namely, the extent to which it can spatially manage the environment and human activities.
The potentially large number of organisations involved may be a challenge to understanding the procedures required for coastal and maritime activities. It is highly likely that the political and administrative structures that relate to the governance of the transboundary area will vary between the jurisdictions concerned. Sectorial responsibilities for coastal and marine affairs, such as licensing, may be divided between different governmental departments, but not in the same manner from one jurisdiction to the next. In order to connect the most appropriate arms of government across jurisdictions, it is important to understand these structures, divisions of responsibilities within each jurisdiction and the similarities and differences involved (see example 5.4.1). For example, sub- national responsibilities will be important in nations with federal structures, but not in more unified states. The municipal level may be significant in some contexts, possibly with transboundary structures at a local scale, but not necessarily elsewhere. Moreover, the resulting plans may not only cover different sectors, but may be highly different in character and legal implication (see example 5.4.2 as well as example 2.3.1).
It is also useful to understand frameworks of consultation in each territory and possibilities for stakeholder involvement (see Chapter 4). A strong stakeholder analysis and involvement strategy is key in order to find the right ‘paths’ for ensuring effective cross-border communication and consultation mechanisms between different bodies engaged in transboundary MSP. In some cases, it may be sufficient that a national planning authority will consult within their own national level stakeholders on cross-border issues – but in most cases, it has proven to be highly useful to closely interact with the given set of transnational sectorial institutions (if existing). One option is to organise targeted meetings per sector, where all interests for a given sector from the whole transboundary area are invited to participate.
Moreover, different approaches and timelines between individual countries’ MSP processes can also be a critical element in case of LMEs. It may be the case that some countries are already engaged in an MSP process, while others are not. This could be possibly ‘levelled out’ by a transboundary MSP ‘project’; which may at least ensure that important information from the country without a statutory MSP is not missed (see examples 5.4.3 and 5.4.4). Nevertheless, experience so far has shown that statutory MSP processes may lead to very different results than pilots and demonstrations carried out without political endorsement, and that important information may only come forward once a country also formally engages in a statutory MSP process.
5.4.1 EXAMPLE: Institutional analysis (Transboundary Planning in the European Atlantic)
Figure 33: Institutional analysis in TPEA (Jay and Gee 2014)
The project Transboundary Planning in the European Atlantic (TPEA) produced a tool to understand administrative structures and responsibilities for transboundary areas along with recommendations for cross-border planning exercises. As shown for Portugal in Figure 33, relevant institutions from each country involved were analysed for their involvement with sectors and their specific role. Definitions of roles included licensing, providing an opinion (sometimes a legally binding opinion), and enforcement. The analysis revealed significant differences between countries at times. For example, in Spain there is a regional model with varying degrees of autonomy between regions and thus responsibilities are divided accordingly between the State and the regions. In contrast, Portugal primarily uses a centralised model (with a few regional exceptions), where decision making power is concentrated at the central level, and operational services are decentralised to regions or local authorities (Jay and Gee 2014).
5.4.2 EXAMPLE: Difference between legal implications and approach of high-level policies vs zoning systems (Scottish and German MSP)
The Scottish MSP process prioritised the development of a National Marine Plan led by Marine Scotland, a Scottish government agency. The National Marine Plan covers both inshore and offshore waters. Marine Planning Partnerships were delegated with marine planning functions and tasked with the implementation of the National Marine Plan at the regional level, to identify local priorities and foster local ownership. However, consenting and licensing remits at the regional level still remain with Marine Scotland. The National Marine Plan sets high-level policies for the use of marine assets and does not specify zones/areas for particular uses, unless for specific cases. This approach fosters co-existence of maritime uses, as exclusion zones are only appointed on a case-by-case basis.
Germany, on the contrary, uses a zoning system for the implementation of its maritime spatial plans. The Maritime Spatial Plans for the German EEZs of the Baltic and North Sea contain three types of zones, including “priority areas”, where one use is granted priority over all other spatially significant uses; “reservation areas”, where one use is given special consideration in a comparative evaluation with other spatially significant planning tasks, measures and projects; and “marine protected areas”, where measures are applicable for the reduction of impacts on the marine environment.
5.4.3 EXAMPLE: MSP process drawings and descriptions - comparative approach (NorthSEE)
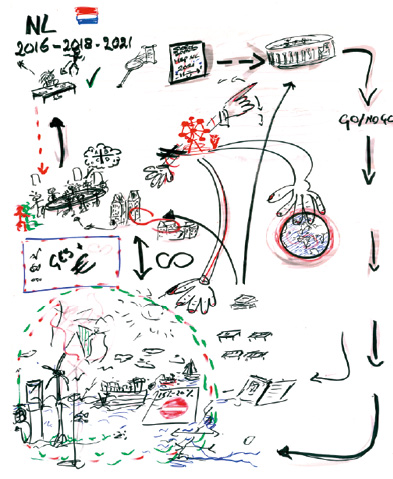
![Comparative drawings of the MSP processes in Scotland and the Netherlands [Cliquer et glisser pour déplacer] ](/images/ebooks/MARINE/Image26040.jpg)
Figure 34: Comparative drawings of the MSP processes in Scotland and the Netherlands. (NorthSEE project)
The NorthSEE project promotes better exchange among MSP authorities and related experts and institutions in the North Sea region. In a project partner meeting of responsible MSP authorities, six countries (BE, NL, DE, DK, SE, NO) and one region (Scotland) each followed the same approach to describe their MSP processes.
The idea was to produce drawings describing each of their MSP processes so that stakeholders could understand on-going and planned activities, also coupled with background information. Every country described the reasons for MSP, how it started and the timeline of the MSP process (see example 5.4.4). A drawing developed by each national MSP authority visualized the processes as shown in Figure 34. Participants had to think how to describe the process in an easy, structured way. Similar processes as well as different approaches became apparent when drawing the figures.
The tool was developed during a NorthSEE partner meeting in 2016 and used in some cases for stakeholder involvement processes. Before the exercise started, participants had to pre-work on national MSP aspects and prepare an overview of relevant knowledge and approaches. An advantage was the trustful cooperation of the MSP authorities developed during previous, joint projects or during EU expert meetings on MSP. When using the tool, a workshop setting with sufficient material is needed. Limitations of using the tool can be the lack of trust between countries to show their way of procedure or too little time having passed since beginning the MSP process to draw what happened so far.
5.4.4 EXAMPLE: Timeline exercise for analysing current status of MSP across a trans-boundary area from NorthSEE project
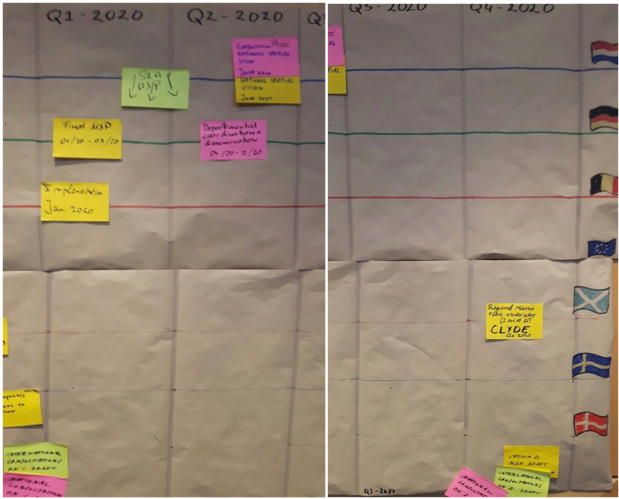
Figure 35: Wallpaper work on timeline of North Sea MSP processes (NorthSEE project)
The tool was developed within the NorthSEE project and jointly elaborated by countries bordering the North Sea (BE, NL, DE, DK, SE, NO and Scotland). During the exercise at a partner meeting, MSP authorities worked on the linear timeline of their processes, starting in the 2nd quarter of 2017 (start of the project) and ending in the year 2021 when all coastal EU Member States are required to prepare cross-sectorial maritime spatial plans according to the MSP Directive. Participants used a common colour coding during the exercise for better comparison: on-going processes (red), cornerstones like the finalization of an SEA (green) and deadlines like the first draft or the final plan (yellow). All timelines were developed on wallpaper simultaneously to enable easy comparison between the countries and to show the current status of MSP across the trans-boundary area of the North Sea (see Figure 35).
The tool was elaborated in early 2018 during a project meeting and seems to have potential to be transferred to other MSP processes worldwide. Participants have been asked beforehand to elaborate on at least 20 specific activities and cornerstones of their national MSP processes to include them during the exercise. This was an important enabling condition for the successful creation of the timeline. Furthermore, of relevance is a trustful atmosphere among the involved MSP authorities due to projects and expert meetings over years. Necessary for the use of the tool is a workshop setting with a number of boards according to the range of the timeline. In case a process just started and there are no visions or strategies in place, which outline the future process, this exercise may be too early to apply.
5.5 Understanding National Priorities and Interests
Apart from different national jurisdictions, transboundary MSP is characterized by the fact that countries have different national priorities and interests – which can, at times, compete or conflict with one another.
MSP is often described to be the tool to resolve those conflicts. It should, however, be noted that a key enabler for a successful MSP process is to find an area or topic, where all countries involved together share the same broader interest and objective which they want to achieve. Only when national interests can be aligned with such higher goals, a discussion rather than a debate is possible, which is a pre-condition to finding a solution. (see section 3.3 for more on this topic).
Partners involved should embark on an analysis of the strategic objectives, priorities and targets in relation to any current maritime activity of relevance in the given area as well as any kind of future developments; e.g. in relation to aquaculture, port development, tourism, energy development, fisheries, environmental protection, etc. (see examples 5.5.1 and 5.5.2). This will enable all involved to gain a better understanding of the given national strategies, priorities and targets, as well as common understanding of joint interests, neutral issues (thus not relevant for transboundary interaction) or indeed competing interests. Please see Chapter 6 regarding analysing future conditions and developing a common vision.
It should be possible to compare priorities; identify synergies between jurisdictions and any differences that limit a joint approach (see example 5.5.3). First, a list of interests from the participating countries should be developed to provide a broad inventory. This can then point towards the need for more detailed discussions on key issues.
A next key step in analysis is to move from a table or list format to actual mapping format; e.g. to highlight and analyse the concrete possible spatial dimension of the conflict on a rough map (please see 5.7). It should be noted that such an exercise at an initial stage does not require a highly sophisticated GIS system, but could be done by simply drawing on printed maps.
5.5.1 EXAMPLE: National Priority analysis (BaltSeaPlan)
The BaltSeaPlan project undertook a national priority analysis to identify priorities and interest relevant to MSP of countries within the Baltic seas. Such analysis is important to understand which priorities or specific targets might have direct or indirect transboundary spatial impacts. The analysis for the project involved initially screening relevant international and national documents and policies that contained spatial/non-spatial targets (binding, suggested or agreed), discussed spatial trends and pressures, conflicts and synergies and informed the various governments’ needs.
The selected policies and documents were analysed to identify common priority themes and priorities within international policies and legislations with reference to the Baltic Sea. Trends and spatial needs in key sectors, its implication, policy response and relevance for MSP across all the countries were also considered as part of the analysis and to understand their implications for the transboundary area. The approach further developed specific recommendations for achieving common targets including expanding and establishing spatial use of renewable energy, interconnected transport network, coherent and well managed MPAs. These tasks are also necessary in outlining structures necessary for coming to joint decision on joint decision on the use shared marine space.
It is important that the application of this analysis in an LME context considers issues and priorities at different spatial levels and engage stakeholders at various levels to give a true picture of the existing situation and possible recommendations for achieving the resulting targets (Schultz-Zehden and Gee 2013).
5.5.2 EXAMPLE: Adapting transboundary marine management approaches and issues into transboundary MSP (CTI-CFF)
In most cases, other transboundary marine management approaches are implemented before the transboundary MSP process begins. These transboundary marine management approaches normally focus on both national and transboundary issues and interest. It is essential that such approaches and issues are considered and ways for incorporating them into MSP are analysed. Such an approach was applied in the CTI-CFF initiative, where previous marine management initiatives and policies such as regional ecosystem approach for fisheries management, action plan for climate change adaptation, MPA systems and networks for the Coral Triangle were analysed and links/overlaps between them and MSP were established. This led to recommendations on how the transboundary MSP process can inculcate spatial and temporal fisheries, MPA and climate change measures. It also informed how the CTI-CFF MSP planning process was designed to ensure that information and mapping exercises inform decision making within and around fisheries management areas and MPAs whiles fostering coherence between spatial actions of these transboundary marine management approaches.
This approach is relevant before the start of the LME MSP process to understand existing conditions and inform the plan design and how existing knowledge and experience can be incorporated. It is important to note that this does not necessarily mean that the resulting recommendations are all adopted.
►Coral Triangle Initiative on Coral Reefs, Fisheries and Food Security (CTI- CFF)
5.5.3 EXAMPLE: developing a ‘matrix of interests’ (Baltic SCOPE)
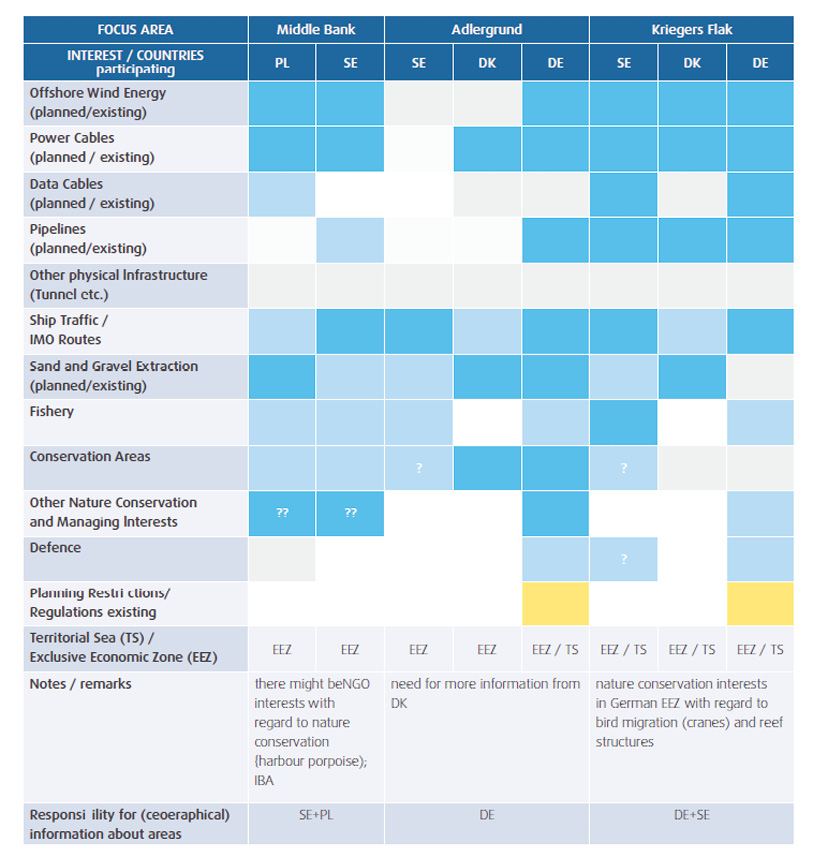
Figure 36: Baltic SCOPE Matrix of Interests for the Southwest Baltic case (Baltic SCOPE 2017)
A matrix presenting an overview of different sectoral interests across countries can help planners understand what the commonalities and disparities are among countries with respect to their national sectoral interests, as well as define key areas of transboundary MSP concerns (see Figure 36). The Baltic SCOPE project has developed a matrix of interests for all countries in pre-defined transboundary focus-areas within the Southwest Baltic Sea. The aim was to identify areas with real transboundary issues from an MSP perspective. As part of the exercise, project partners from each country were required to collectively fill in a matrix with the present, and potential (planned) national sectoral interests. The matrix was organised in a way that focus-areas where shown along the horizontal axis, while the vertical axis indicated the different national sectoral interests, with high and low priority being differentiated by using different colour shades. An overview of existing international regulations was also added to the matrix. By visualising the priorities of different countries for each focus-area, the exercise helped to identify opposing interests and to identify potential conflicts. At a general level, the exercise also helped to document how the project partners reached certain decisions, which can be an important element when communicating results to stakeholders.
5.6 Understanding the ecosystem-based approach (EBA)
Developing an ecosystem-based approach to MSP is essential for ensuring sustainable sea-use and protecting the environment. EBA allows for considering a transboundary area as one system, with all its interlinked components, processes and relationships, be it of environmental or anthropogenic nature. EBA is at the very core of the LME, as its application can address connectivity of species (see example 5.6.1), migratory routes (see example 5.6.2), and food webs, as well as anthropogenic effects to these processes. EBA is also discussed in the Strategic Approach Toolkit Chapter 2: The ecosystem-based 5-module approach and recommendations for strengthening the approach and Chapter 5 section on Ecosystem-based Management, and in the Governance Toolkit Chapter 3.2.1: the Ecosystem Approach to Fisheries Management.
Whereas almost all existing MSP processes throughout the world aim towards application of EBA, almost all existing cases of transboundary MSP experience have revealed significant differences on how countries interpret and implement EBA (see section 2.2.1 for more discussion on EBA and MSP). The section that follows here presented concrete tools for incorporation EBA in MSP.
As a very first step, it may be useful to establish a specific task force to deepen common understanding of the concept and to elaborate on how to promote its application in MSP. Such a task force may develop a concrete ‘checklist toolbox’ to be used by all partners and countries involved during the various planning stages (see example 5.6.3).
It should be noted that the actual application of EBA within MSP is, however, often also limited by the actual mandate of the bodies involved either in view of being able to influence (1) all the necessary maritime activities affecting the ecosystem in the plan area or (2) the mismatch between jurisdictional borders they are in charge of and the actual boundaries of the given ecosystem (see 2.2 and 5.2 for further discussion, and example 5.2.1). These two aspects are at the very heart of the motivation for transboundary MSP at LME level..
5.6.1 EXAMPLE: Evaluating large-scale habitat connectivity for sandeels (North Sea)
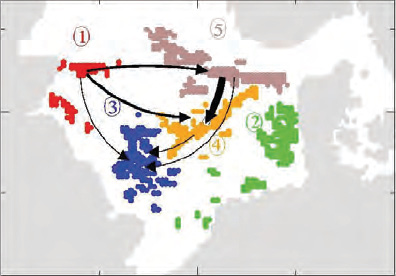
Figure 37. Proposed regional habitat aggregations for the North Sea lesser sandeel (Blaesbjerg et al. 2009)
A study conducted as part of the PROTECT project investigated recruitment and population dynamics of the North Sea lesser sandeel to evaluate habitat connectivity in the North Sea. Findings showed that habitats are connected over very long distances, and that the population size in one area can be influenced by changes in fishing pressure and environmental parameters from other areas. This shows the importance of spatial biological models, and should include ocean currents. The study also analysed the appropriateness of current management units, which at times artificially divide habitats that are naturally connected. The study proposed regional habitat aggregations to better inform management decisions (see Figure 37), and highlighted the importance of considering habitat connectivity at a large scale in transboundary MSP as well as fisheries management.
5.6.2 EXAMPLE: Tool on assessing migratory fish stocks (FAO)
The FAO manual describes a range of methods to assess migratory (trans-boundary) fish stocks. Migration of different fish species and stocks are well known especially in the EU sea basins to avoid bias in sampling and misinterpretation of results. The manual is based on this knowledge and provides information on the following methods to interpret the length-frequency data obtained from migratory fish-stocks and to transfer the knowledge to tropical regions:
•Method A: The annual-return matched samples method
•Method B: The general matched samples method
•Method C: Assessment based on tagging data
•Method D: Estimation of the growth parameters of migratory stock: The Atlantic Mackerel
Method A is based on the assumption that a fish stock follows a predictable migration route. If this migration route is known (e.g. from tagging experiments) in time and space we are in a position to follow the cohorts and to “match” samples so that they originate from the same cohort. Consider a simple hypothetical model (Figure 38):
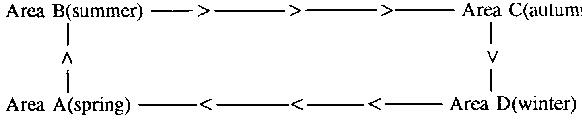
Figure 38: Hypothetical model A for migratory fish stocks (Sparre and Siebren 1998)
The approach of Method B (Figure 39) assumes that we have knowledge or a hypothesis of the migration route in time and space, and therefore are able to “match” samples so that they originate (or can be hypothesized to originate) from the same cohorts:

Figure 39: Hypothetical model B for migratory fish stocks (Sparre and Siebren 1998)
The success of tagging experiments (Method C) depends on the ability and willingness of the fishermen and others dealing with the catch to report on where and when the marked fish was caught. If the data are used also for estimation of growth parameters the size of the recaptured fish should be reported as well. The fishery must cover a relatively large part of the distribution in space and time of the stock to secure a reasonable number of recaptures for the estimation procedure.
Method D deals with seasonally migrating species sometimes migrating earlier in the season the older and bigger the fish are. The problem is analysed in well-documented studies of a stock of the North Atlantic mackerel (Scomber scombrus).
All presented methods have been applied in research cases, not in pilot plans of MSP or real MSPs.
►Introduction to tropical fish stock assessment. Part 1 – Manual
5.6.3 EXAMPLE: A checklist to apply the ecosystem approach in MSP (Baltic SCOPE)
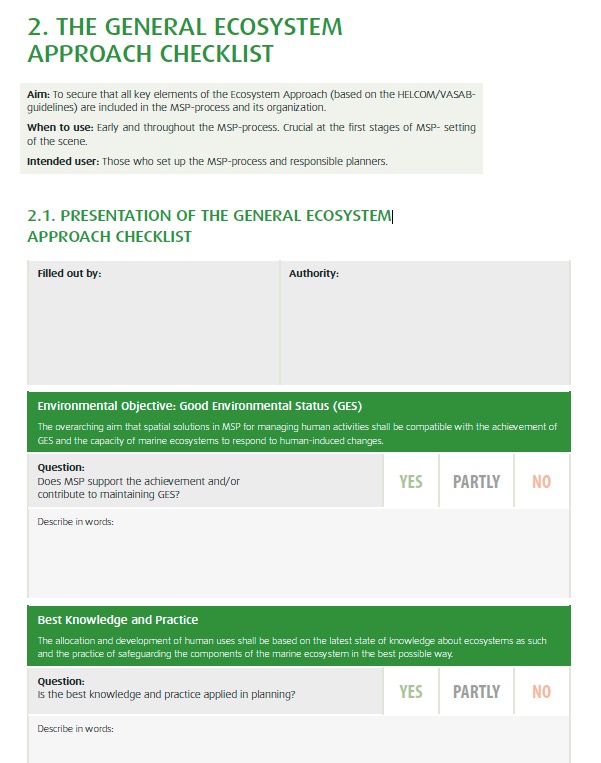
Figure 40: Baltic SCOPE Ecosystem Approach Checklist (Crona et al. 2017)
Planners may use a checklist to harmonise their understanding of what the ecosystem approach involves, and how it can be used in MSP. Ambiguity among stakeholders on what the ecosystem approach should entail could result in unsuccessful MSP processes that only apply certain elements of the approach. The Baltic SCOPE project developed three such checklists for planners which include transboundary dimensions. They support stakeholders with the inclusion of the key elements of the ecosystem approach in the maritime planning process. They are also meant to analyse the extent of common views.
5.6.4 EXAMPLE: Transboundary ecosystem-based approach (Wadden Sea Management Plan)
The Wadden Sea, stretching over 500 km along the North Sea coast of the Netherlands, Germany and Denmark, is the largest trans-boundary transitional water body in Europe. It is an area of multiple jurisdictions and subject to the same requirements of EU policy and legislation. The principle of defining a shared vision is laid down in the Trilateral Wadden Sea Plan and constitutes the common trans-boundary policy and management plan for the Wadden Sea Area. The plan expresses a shared vision of the aspired ecological state of the Wadden Sea as a unique tidal transitional water body and its ecosystems. A very clear-cut vision is the biggest positive experience of the Management Plan for Wadden Sea that can be exchanged internationally.
The vision of a transboundary ecosystem-based approach is outlined as follows:
•A healthy environment which maintains the diversity of habitats and species, its ecological integrity and resilience as a global responsibility;
•Sustainable use;
•Maintenance and enhancement of values of ecological, economic, historical-cultural, social and coastal protection character, providing aspirations and enjoyment for the inhabitants and users;
•Integrated management of human activities which takes into account the socio-economic and ecological relationship between the Wadden Sea Area and the adjacent areas;
•An informed, involved and committed community.
►Comprehensive management plan for the Wadden Sea
5.7 From Common Mapping to Joint Data Portals
Producing common maps for a transboundary area is essential to understand the given LME as one system without division into national interests. Maps can be used at multiple stages of the MSP process and are especially useful for:
aCommunicating among the planning team in order to increase understanding of the actual state of play of current and future conditions in the whole LME;
bCommunicating to, and information sharing with, stakeholders. This further contributes to better understanding of spatial implications of sectoral activities, as well as transboundary issues;
cMapping the maritime resources of transnational interest (e.g. fish stocks, offshore wind);
dIdentification relevant transboundary focus-areas; and
eRevealing patterns and trends at a greater scale.
5.7.1 Starting off with initial mapping / sketching exercises based on expert knowledge
Even for a national level MSP, gathering data is often a challenge, as it includes collection and integration of existing data from various sources, including different sectoral authorities, research institutes or even different levels of government. At a transboundary scale, these challenges increase even more. Thus, before embarking on a resource intensive joint data gathering exercises for transboundary MSP, a simple pragmatic approach can be taken making good use of the existing knowledge available within the planning team and stakeholders.
Availability of data should not represent a prerequisite for planning and stall the process. It is sufficient to start off with less precise methods resulting in rough sketches and maps with less detail, as long as focus areas of common concern can be identified; which can then be potentially further analysed at a later stage.
Numerous MSP projects and processes throughout the world have made good use of participatory mapping methods (see examples 4.4.4, 5.7.1.1, and 6.3.2).
5.7.1.1 EXAMPLE: Participatory mapping to support transboundary MSP (Grenada Bank)
A participatory GIS system was developed for the Grenada Bank (which includes both Grenada and St. Vincent and the Grenadines), known as MarSIS: Marine Resource Space-use Information System. The system integrates in social, economic and environmental information drawn from both scientific and local knowledge to provide a basis for coastal and marine planning and management. Stakeholders were engaged in meetings, data collection efforts such as field surveys, and a dedicated internet forum to provide local information, which helped foster a sense of ownership in the MSP process. MarSIS applied a participatory GIS approach to provide a framework for data management and information integration, as well as subsequent ecosystem-level GIS analyses. MarSIS was used as part of designing a marine multi-use zoning design for the Grenada Bank, and helped support management and conservation capacity in the region. The process also highlighted mismatches between jurisdictional and socio-ecological scales, which requires further consideration in future MSP exercises. (Blue Solutions 2015)
5.7.2 Prioritising / selecting relevant data used for joint maps
Creation of maps and analysis that involves spatial aspects of marine activities and environmental processes is a prerequisite for any MSP exercise. At same time, any project which considers to embark on the creation of a joint database has to be aware that gathering relevant data for a transboundary area may be a potentially very time-; labour- and therefore also, financially consuming process, especially when carried out for the first time.
There is a large amount of data that could be potentially compiled for a transboundary area. However, it is key to select the most relevant data. Data topics should be prioritized based on the MSP issues identified, focusing on data that is possible to obtain rather easily. It should be kept in mind that a transboundary MSP exercise may not require the same amount of data as a national MSP process, given the fact that not all maritime activities are really of transboundary nature, nor all decisions need to be taken at transboundary scale. Much of the information which is relevant for MSP may already be collected as part of the ecosystem-based 5-module approach (see the Strategic Approach toolkit Chapter 3). Indicators included in Section 3: Programmatic Implementation and Section 4: Environmental and human well-being status from the LME-LMSA Scorecard may also help focus data collection efforts.
Data collection across countries should ideally be based on accepted criteria that specifies data categories that are of mutual interest, as well as preferable data formats. It is also important to define what is the temporal scope to be considered, so that data should cover not only the present status, but also past and future trends where possible. Data related to certain marine activities might be easier to integrate and present on a map as there may already be a common method of data collection (e.g. AIS system used in shipping). In these cases, issues of harmonizing data from various sources may be avoided. For other activities and processes (e.g. fisheries, ecosystem features) it may be much more difficult to come to a common system, as data collected is not coherent in terms of format, time frames, etc. and requires harmonisation.
Collecting, analysing and presenting large amounts of data may be challenging not only in view of resource constraints, but also may at certain stage be counter-productive. For clear presentation on the map it is important to select only the most relevant combination of data that can provide valuable insights for decision making. These are often spatial implications of current and future human activities (including MPAs). For environmental characteristics, planners are mainly working with information (sometimes in the form of ‘indicators’) rather than data as such. Moreover, to guide planning decisions, planners are eventually interested in qualitative information that can answer questions such as ‘which areas are most important for fisheries in the transboundary area?’. Information on the socio-economic importance of activities are also relevant to planners and can answer questions such as ‘how much does it cost for ships to take a different route?’ and ‘what is culturally important (e.g. traditional regatta) in the given area?’. This kind of data is usually collected from stakeholders involved in to the process (please see chapter 4 Stakeholder engagement in Transboundary MSP). Further discussion on data assimilation can be found in the Strategic Approach Toolkit Chapter 3 section on TDA.
5.7.2.1 EXAMPLE: Identifying research needs and relevant data (Rhode Island Ocean SAMP)
To identify research needs, the Ocean SAMP (Special Area Management Plan) team reviewed what are the required information for offshore wind siting and installation, the Environmental Impact Statements from planned commercial activities in the area, the topics discussed in other relevant initiatives, and spoke to many of the stakeholders. Early on, a multi-day event was held with researchers who had, over the years, researched different aspects of the Ocean SAMP study area, to gain a better understanding of available information. The research topics were prioritized and project planned based on the issues identified and the gaps in existing information. The process of prioritizing the research as well as describing its scope was shared during stakeholder meetings and through the web site. Whenever possible, researchers employed local fishermen to engage in the Ocean SAMP research. Fishermen felt that more research should be done on fishing and fisheries, and pointed the team in the right direction based upon their local knowledge. Representatives of tribal communities were also involved in to the process, providing important information about cultural heritage. (McCann and Schumann 2013).
5.7.2.2 KEY RESOURCE: Common data categories used for MSP throughout Europe
A study published by the European Commission, “Evaluation of data and knowledge gaps to implement MSP”, researched the most commonly used data categories and sets by European MSP Planners. The study has emphasized that defining common data categories to be collected and presented on a map is a useful exercise for planners engaging in transnational MSP, as it allows for the creation of a common understanding between the countries involved and thus will enhance cross-border cooperation. As a first step, planners may analyse what data and knowledge are needed for decision-making on MSP, taking into account the different scales and points in the MSP cycle. Sources may include past and current MSP projects, publicly available documents from the industry and sectoral authorities (including environmental impact assessments and strategic environmental assessments), public databases (cadastres and registers), scientific literature as well as other relevant initiatives. Based on this analysis, planning authorities have to define what data and information is stored where and in what format, and determine whether this is sufficient to meet minimum MSP requirements. Guiding questions could include whether the required data exists at all, if its spatial coverage is comprehensive, whether it is freely accessible and compatible, as well as whether any raw data exists that could be transferred to required data formats. The study itself is also a key resource to any MSP data building effort throughout the world as it shows the most important data categories, which have been commonly used by all EU MSP processes so far. (European Commission 2017e).
5.7.2.3 EXAMPLE: Transnational Marine Spatial Data Infrastructure (BalticLINes)
The BalticLINes project is developing a Marine Spatial Data Infrastructure (MSDI) prototype for Maritime Spatial Planning for the Baltic Sea Region. This infrastructure will be accessible as an interactive web-map user interface for accessing, analysing and displaying cross-border data. The data infrastructure will be partly decentralised, meaning that some of the datasets will be accessed in real-time at the original source as opposed to data being fed into a central database. The added value of a decentralised system over a centralised system is that data will be up-to-date since it is administered and delivered by the data owners.
A decentralized system needs all datasets to be published through web services in standardised formats. Since not all MSP datasets are yet available using standard protocols, the prototype will use a “hybrid” approach to access datasets from original sources and from centralized systems.
The Baltic LINes data infrastructure will support maritime spatial planners in the Baltic Sea Region to understand and take into account the sea use and nature protection situation in neighbouring countries. Also, the tool may be used in MSP consultations instead of printed maps.
The version of the data infrastructure that is under development focuses on data for planning energy infrastructure and shipping routes in MSP. However, the scope of the data infrastructure will be expanded in the future. Furthermore, the data layers showing MSP designations may be integrated in the future.
Apart from the practical issues of harmonising data standards across various boundaries (see 5.7.4); there may also be issues of general unwillingness to share relevant data in transnational settings. While this is already an issue at national level – this is even more prone to happen at transboundary level in view of safeguarding national interests. An example for this is reluctance of national authorities to share the information on military training areas, but it can also relate to any other (economic) national interest. The BalticScope project has found a pragmatic approach to work around this, which enables planners to still work with the full set of information available and thus take decisions on the basis of the full picture (see example 5.7.3.1).
5.7.3.1 EXAMPLE: Practical solutions for cross-border data-sharing (Baltic SCOPE)
Open exchange of reliable data is essential for transnational MSP processes, but national regulations often make it very difficult for planners to share their data with other parties. Data sharing is also made highly complex as countries often have different national input data, not to mention the fact that the information and data is often very dispersed within a country. Planners involved in the Baltic SCOPE project have overcome the barrier of reluctance in data sharing by very pragmatic means. Instead of encouraging all planners involved to make use of one given data porta and thus actually sharing the data, the planners were asked to bring their own laptops to the meeting. This facilitated an exchange whereby each planner was able to show the other parties what they were working on, without revealing their proposed planning solutions. This allowed for the joint development of planning solutions between all planners involved, without any of the planners being forced to actually share their information with others. (Urtāne et al. 2017).
5.7.3.2 EXAMPLE: Public private collaboration for data collection (US RHODEO study)
The construction of the first turbine in the US offshore environment offers an opportunity to address many of the environmental questions that are of concern to the public. Many national agencies have mandates to protect the environment and will need to know more precisely what wind development will involve. Through a collaborative effort with agencies on different levels of government, the construction and operation of offshore wind turbines is studied to gain insight into the actual disturbances to the environment. Without these real-time observations, analyses are based on best guesses and scenarios that are conservative. An analyst relies on the best available information and assumptions about the activities based on previous experience.
For offshore wind development, there is no previous experience, so the analyses and subsequent mitigation measures are based on an educated guess. With RODEO study in place these planning and management measures will benefit from real-time, independent observations during actual construction activities (BOEM 2015).
Given that countries are referring to different data standards, all data used for analysing and visualisation first needs to be harmonised. Moreover, symbols, legends, as well as terms used in mapping also differ across countries, and those to be used in a transboundary map need to be agreed upon.
At the transboundary level, datasets required may differ in many ways across adjacent jurisdictions, e.g. in view of collection methods, reference systems, quality, spatial scales, time-frames and attributes. This may be due to things such as different purposes for which data was collected; or different methods of measuring or handling data. In order to harmonise this data, it is helpful to consider a data model which sets out principles and standards for data collection. This will facilitate harmonisation of data into a single shared database. To streamline coordination of future data collection, the involved partners should carefully document the ways in which datasets collection methods vary (e.g. one is collected every two years and another every three years).
5.7.4.1 EXAMPLE: Decentralised data portals (EmodNET, Atlas of Ocean Wealth, US Marine Cadastre)
EMODNet Human Activities Portal provides information on the geographical position, spatial extent and attributes of a wide range of marine and maritime human activities throughout Europe. Where possible, portal also provides historical time series to indicate the temporal variation of activities. Data for the portal is continuously collected from a multitude of public and private data sources at EU, international, national, and local level. The methodology adopted is that, as far as possible, each activity should be covered by a single source that can provide data for all EU sea basins. This makes it possible to obtain complete and already harmonised datasets, thus reducing the risk of data gaps. When it is not possible to have a single source covering an entire activity, national and local sources are surveyed. EMODNet Human Activities Portal is particularly relevant for MSP as it provides access to an expanding collection of harmonised datasets covering human activities across all European Sea Basins. These range from established activities such as fisheries and shipping to more recent activity such as construction of offshore energy facilities. EMODnet also ensures that the data generated from various initiatives and projects, are safeguarded and made available for re-use beyond their life time. Data from the portal can be useful in scoping phases of the national MSP processes and trans-boundary and cross border planning initiatives.
Atlas of Ocean Wealth is an online tool that provides scientific information in a clear and useful way to aid decision- makers at the local, national and even international levels to better understand the true value of the ocean environments. It provides stakeholders the maps and data needed to make better, evidence-based ocean-use decisions. Mapping Ocean Wealth aggregates existing science and uses tools and maps to make science more accessible to audiences at all levels, globally. Higher-resolution models illustrate the value of oceans at broad scales to inform decision-making at the national and international levels. Meanwhile, fine-resolution maps and models improve local planning and management.
On the other hand, the National Portal at MarineCadastre.gov was developed as a collaborative effort among a number of non-governmental organizations. The website is an integrated marine information system that provides data, tools, and technical support for ocean and Great Lakes planning. It is recognized by regional ocean governance groups as the central place for authoritative federal data, with data, metadata, and map services from the project being integrated into the Northeast Ocean Data Portal, Mid-Atlantic Ocean Data Portal, and West Coast Ocean Data Portal. The Regional portals consume National-level data and are used to identify multi-use areas when siting projects, identifying compatibility, and providing data to support ocean action plans; they may also contain data specific to a region (e.g., state-created recreational data).
5.7.4.2 EXAMPLE: National marine data infrastructures in Canada and Australia
Significant efforts have been made on the national level to overcome the tradition of holding data in silos for in-organization/institution-use only. In Canada, through the adoption of the national spatial data infrastructure, also called Canadian Geospatial Data Infrastructure (CGDI), or “GeoConnections”, Canada got to an interoperable marine spatial data infrastructure based on widely adopted international standards which offers marine data. The CGDI is divided into twelve nodes, with one of the nodes being Marine Geospatial Data Infrastructure that assists the economic and social needs of Canada’s marine regions and the management of Canada’s water resources. COINAtlantic is another initiative inside the CGDI which has implemented a coastal and ocean information network for the western North Atlantic. The network provides open access to spatial data to support integrated coastal and ocean management by adopting all standards of and complying with the architecture of the national data infrastructure.
In Australia, two approaches are tying the Australian Spatial Data Infrastructure: (1) Australian Marine Spatial Information System (AMSIS) that focuses primarily on “framework” data (boundaries, cadastre, infrastructure etc.). This is a web based interactive mapping and decision support tool that offers access to over 80 layers of information in the Australian marine jurisdiction including maritime boundaries, bathymetry, physical and environmental information, legal interests, fisheries and shipping; and (2) Integrated Marine Observing System (IMOS) Ocean Portal that offers a variety of data mostly from scientific research (e.g., biological and climatic data). This is a distributed set of equipment and data-information services, which, among many other applications, aims at meeting the needs of the research community in Australia. The strategic focus is on the 4-dimensional ocean variability and the impact of major boundary currents on the continental shelf, ecosystems, and biodiversity. The IMOS uses a modified version of GeoNetwork holding ISO 19115/19139 standard records, which provides data discovery, access and download.
What is relevant for the transboundary context and coherence of data across countries is the fact that the ANZLIC (Australia New Zealand Land Information Council) is coordinating the implementation of metadata guidelines and built a metadata profile based on the widely adopted metadata standard ISO 19115 which both the AMSIS and the (IMOS) Ocean Portal use (Seip and Bill 2016).
MSP is widely understood as an evidence-based process. Nevertheless, data and information collected throughout the process require synthesis and further analysis and/or interpretation before it can be used to support the development of maritime spatial plans and the decision-making process.
Numerous projects have developed various assessment tools and used to support the interpretation of information and build evidence for MSP. However, there is very little evidence that these are used by MSP authorities in national statutory MSP processes (European Commission 2017e).
The analysis of conflicts and synergies is likely to require evidence on spatial and environmental compatibility of different activities and impact assessments. In many cases, such conflict analysis may not refer to current conflicts, but relate to finding space for ‘new’ uses coming in (e.g. offshore wind, aquaculture, new MPAs). User-user conflicts and user-environment conflicts will need to be assessed. Different evidence is needed for developing scenarios for future sea use management, such as trends and forecasts in the planning area, which are not yet defined as a specific claim by a given sector, or a concrete demand from the policy level, as well as other relevant policies than can have more long-term goals. Further discussion on identifying issues to be addressed can be found in the Strategic Approach Toolkit Chapter 3 on TDA, the LME Project Cycle Toolkit Chapter 3: Preparation of Transboundary Diagnostic Analysis (TDA) Projects, or using the methodology included in the LME Scorecard.
5.8.1 Data analysis and visualisation tools
A number of data analysis and visualisation tools have been developed over the years to aid decision making in land use as well as marine spatial planning. The geographic information systems (GIS) described in 5.7 are generally used for MSP to store, visualize, and analyse spatial data and model the potential consequences of alternative plans. However, a number of other, also web-based, analytical tools have developed over the years (see examples 5.8.1.1). Moreover, specific modelling techniques have also been improving (e.g. using machine learning algorithms, time series, models for ecosystem services assessment, etc.) (see examples 5.8.1.2, 5.8.1.3, 5.8.1.4).
SeaSketch is a flexible online mapping platform that has been used for MSP in the United States, Canada, New Zealand, Barbuda, Montserrat, Curaçao, the Galapagos Islands and Indonesia. SeaSketch, which facilitates iterative, collaborative design of spatial management areas, includes built in analytical tools “collaborative geodesign”. Configured to reflect the planning goals and objectives specific to a given MSP initiative, SeaSketch offers users the ability to view spatial information about the distribution of human activities, natural resources and infrastructure in and around the ocean. Then, using this information as a guide, users can sketch prospective ocean zones and analyse whether they meet science and policy guidelines for ecosystem protection, economic impacts to ocean users and their relative trade-offs.
Frequently, stakeholders have information about how ocean space is used and valued - information that is essential for planning but that is often unrepresented as spatial (map) data. SeaSketch is used to conduct crowdsourced and facilitated surveys in which stakeholders may contribute this information and express these values. Because stakeholder participation is central to any successful MSP effort, SeaSketch has features that allow planners to track, visualize and quantify user activity. Using this information, planners may target underrepresented users or stakeholder groups and geographies to ensure proper representation in the process.
For example, in the Caribbean, SeaSketch surveys were used to collect information on the distribution of valued fishing and diving areas, which, ultimately, were represented in heat maps of ocean uses. These data have proven essential in evaluating the potential impact of marine protected areas on local ocean users that may be displaced by these zones. SeaSketch was also used in the MOZALINK project that aimed to develop data, knowledge and solutions to support transparent, sustainable and science-based Marine Spatial Planning (MSP) in the Western Indian Ocean.
Map-based forums in SeaSketch can be communication tools once plans have been finalized. Decision makers may use this tool to expose plans, map data and analytical reports, and perhaps the dialog used to justify marine spatial plans.
5.8.1.2 EXAMPLE: Marxan - software for designing reserves as part of systematic conservation planning (Ritmare and BaltSeaPlan)
Marxan is one of the most widely used decision support software (DSS) for conservation planning. it uses an optimization method for site selection, searching for the most cost-effective suggestions for suitable marine conservation areas that meet a number of ecological, social and economic targets. Results can be influenced by changing parameters such as clustering, or altering the importance of different targets. The advantage of Marxan is that scenarios can be developed, which can then be taken as a basis for finding solutions.
Within the Ritmare project and with the support of other projects (Adriplan, Supreme, Erasmus Mundus Master Course on MSP), Marxan and its advanced version Marxan with Zones were applied to the Adriatic-Ionian Region for biodiversity conservation and to the subarea of the Italian Emilia Romagna Region with a specific focus on achieving the goals of sustainable development of aquaculture activities and biodiversity conservation. The use of Marxan and Marxan with Zones requires skilled expertise and resources. Moreover, it relies on wide data input; if not supported by dedicated projects (as ADRIPLAN in this case) data collection and structuring can be time and resource consuming activities. Marxan scenarios depend on set assumptions (as in the case of any DSS); results of the software application should be considered as starting points for stakeholder discussion and decision making, rather than scientifically-based decisions.
Within the BaltSeaPlan project, Marxan was used in a case study area to identify potentially suitable areas for offshore wind farming (Baltic LINes 2016). The case study took a transnational approach to the pilot area, seeking to identify those sites that have the lowest construction costs, make optimum use of the available wind and take account of the various spatial restrictions. A key advantage of using Marxan was that it showed data gaps and the difficulties of parameterization (thus, frequent feedback was necessary). Whilst the investment costs for offshore wind farming can be readily calculated, assigning cost values to nature conservation is an arbitrary exercise (how much is a Natura 2000 site worth). Also, not every conflict can be put into figures, so that the scenario maps may look deceptively complete but not really reflect the complete real situation. Much of using Marxan depends on the work of the planning group and their understanding of how to use a decision support tool. Therefore, close contact between the modeler and the planning group is advantageous. It should also be kept in mind that the results are directly influenced by the chosen simplified settings and should not be over-interpreted.
5.8.1.3 EXAMPLE: InVEST - a decision-support tool for valuing nature
InVEST provides free, open-source software models used to map and value the goods and services from nature that sustain and fulfil human life. It enables decision makers to assess quantified trade-offs associated with alternative management choices and to identify areas where investment in natural capital can enhance human development and conservation. The toolset currently includes eighteen distinct ecosystem service models designed for terrestrial, freshwater, marine, and coastal ecosystems. InVEST models are spatially-explicit, using maps as information sources and producing maps as outputs. InVEST returns results in either biophysical terms (e.g., tons of carbon sequestered) or economic terms (e.g., net present value of that sequestered carbon). The spatial resolution of analyses is also flexible, allowing users to address questions at local, regional, or global scales.
Further discussion on the methods for assessing the value of ecosystem services can be found in the Environmental Economics Toolkit Chapter 4.
►INVEST: Integrated Valuation of Ecosystem Services and Tradeoffs
5.8.1.4 EXAMPLE: Ecopath ecological modelling software
Ecopath with Ecosim (EwE) is an ecological modelling software suite for personal computers that has built and extended on for almost twenty years. The development is centred at the University of British Columbia’s Fishery Centre, while applications are widespread throughout the world. EwE is the first ecosystem level simulation model to be widely and freely accessible. EwE has three main components: Ecopath – a static, mass-balanced snapshot of the system; Ecosim – a time dynamic simulation module for policy exploration; and Ecospace – a spatial and temporal dynamic module primarily designed for exploring impact and placement of protected areas. The Ecopath software package is particularly useful in situations where for example there is a need to address ecological questions; evaluate ecosystem effects of fishing; explore management policy options; or analyse impact and placement of marine protected areas.
►Ecopath with Ecosim website
5.8.1.5 EXAMPLE: Adaptive Marine Policy (AMP) Toolbox
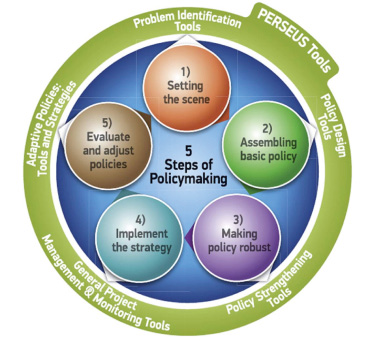
Figure 41. Adaptive Marine Policy Toolbox
The Adaptive Marine Policy (AMP) Toolbox was developed as part of the PERSEUS project to assist marine policymakers to achieve or maintain heathy status of coastal and marine ecosystems in the Mediterranean and Black Sea basins. The purpose of the AMP is to make scientific information and resources readily available in a user-friendly format to assist policymakers, scientists and policy practitioners to formulate policies that will benefit the marine environment. The tool box is in three parts including a 5-stage adaptive policy cycle/framework (APF), thematic data bases and models and relevant examples/case studies. The APF is based on a step-by-step cyclical approach to policy making, where the sequence of phases is structured in five interactive steps (shown in figure 41). The set of tools and methods collated as part of the toolbox delivers both scientific and non-scientific knowledge for analysing and describing the state of marine ecosystems and assessing the impact of human activities, economic and social interests in relation to each stage of the APF.
It is important that potential users of this tool adapt it to fit their specific resources, geographical context and needs as the tool is specifically designed for Southern European Seas. The application of the AMP toolbox also requires periodical update of the ‘Database of tools and methods’ with new research evidences, tools and methods, to provide users with the most recent array of instruments. Dissemination of the tool to the wider end users of the tool to inform its contents and use is also essential. Although, the toolbox is easy to use, the simplicity and accessibility of the toolbox for a wide stakeholders’ and decision makers, limits its use for complex issues which require more advanced technical and scientific skills (e.g. ecological assessments, cumulative and spatial impacts analysis). Data provided by process-based models and monitoring systems as well as environmental and climate projections, are also not included in the toolbox.
►PERSEUS Adaptive Marine Policy Toolbox
5.8.2 Cumulative Impact Assessment
Assessing cumulative impacts of combined environmental effects of multiple activities may increasingly facilitate the actual application of EBA (see section 5.6). Cumulative impact tools can be used to assess the extent of environmental impacts of scenarios developed as part of an MSP process, or planned activities resulting from MSP, on a range of environmental resources. Designing and applying cumulative impact assessments ensures that an ecosystem-based approach is used in MSP through the evaluation of environmental effects. They can also be used in developing an accompanying Strategic Environmental Assessment (SEA) for an MSP (if required), which would ideally identify a means of anticipating and avoiding cumulative negative impacts on the environments. Cumulative impact assessments can most effectively contribute to transnational MSP by evaluating effects of activities in hotspots, or areas where a high level of activity is anticipated to occur (please see section 5.2 for more on hotspots). Cumulative impact assessment is also included as part of the ecosystem-based 5-module approach (see the Strategic Approach toolkit Chapter 3). Other impact assessment processes including SEA and environmental impact assessment can be found in Chapter 3 of the Environmental Economics Toolkit.
5.8.2.1 EXAMPLE: Cumulative Impact in an MSP Plan (Massachusetts Ocean Marine Plan)
The Massachusetts Ocean Management Plan translated policy direction and specific requirements of the state’s Oceans Act into a comprehensive management approach which are implemented through state programs and regulations. A cumulative impact tool was used to map spatial distribution of ecosystem services and human activities relative to marine habitats through series of processes. The cumulative impact model used in this case combines ecosystem vulnerability, ecosystem distribution, and distribution and intensity of human stressors, which were vetted at global and regional scales.
Cumulative impacts were modelled at each location in a 250m grid by adding up the combined impacts of the suite of human stressors that occur there, weighted by the average vulnerability of the ecosystem(s) found in that grid/location to each stressor. The weights used are the ecosystem vulnerability scores which was derived through a survey of regional ecological experts and application of other global methods. Maps developed of the ecosystems were based on the best available data, but for some ecosystem types and some places, they could not be developed due to, data gaps. Important impacts such as changes in freshwater runoff and sedimentation, some sources of nutrient addition, or direct human disturbance from coastal visitation at this time, because data gaps and inadequate models.
The use of this approach therefore requires sufficient data on ecosystem and human activities in combination with expert knowledge. Although, the process does not prescribe particular management decisions, it can be used in addition to other tools that analyse ecological, economic, and social values to inform decision-making. (Kappel et al. 2012)
5.8.2.2 EXAMPLE: Applications of cumulative impact assessment tools
SYMPHONY is the tool designed to support the Swedish MSP process to implement the ecosystem-based approach and develop an accompanying Strategic Environmental Assessment. The tool can be used to map results of different scenarios using the SeaSketch interface (see 5.8.1.1), in order to display user-friendly outputs.
Figure 42: Example of results from SYMPHONY tool
Tools4MSP is another example, available on-line. It includes a Cumulative Effects Assessment component which can be customised for a pre-configured case study (spatial domain, time reference, resolution) using user- provided data. The online tool generates geospatial results and statistical outputs to inform MSP decision-making.
Figure 44. Example of results from Tools4MSP cumulative impact tool
The SIMCelt project considered a methodology and process for cumulative effects assessment in a MSP transboundary context by assessing seabed disturbance caused by multiple activities in two pilot areas including the Irish Sea and the coast of Brittany. The process analysed spatial data about human activities, pressures and the sensitivity of the receiving environment. The combination of these processes resulted in defining the cumulative/ concomitant effects. The results of the CEA assessment have also been illustrated on a web-based story map and video, which also indicates the challenges of CEA in transboundary MSP. The approach used indicates the need for best available spatial and temporal data and considering the risk of impact and effects.